
SHEAR FORCE AND BENDING MOMENT DIAGRAM
SHEARFORCE AND BENDINGMOMENT DIAGRAM Shear Force: The shear force at any section of a beam is equal to the algebraic sum of all the forces either to the left or to the right of the section. S.F is denoted by the letter F and its units in Sl are kN.
The beam may also state the unbalanced vertical force to the left or right of the section at the cross-section.
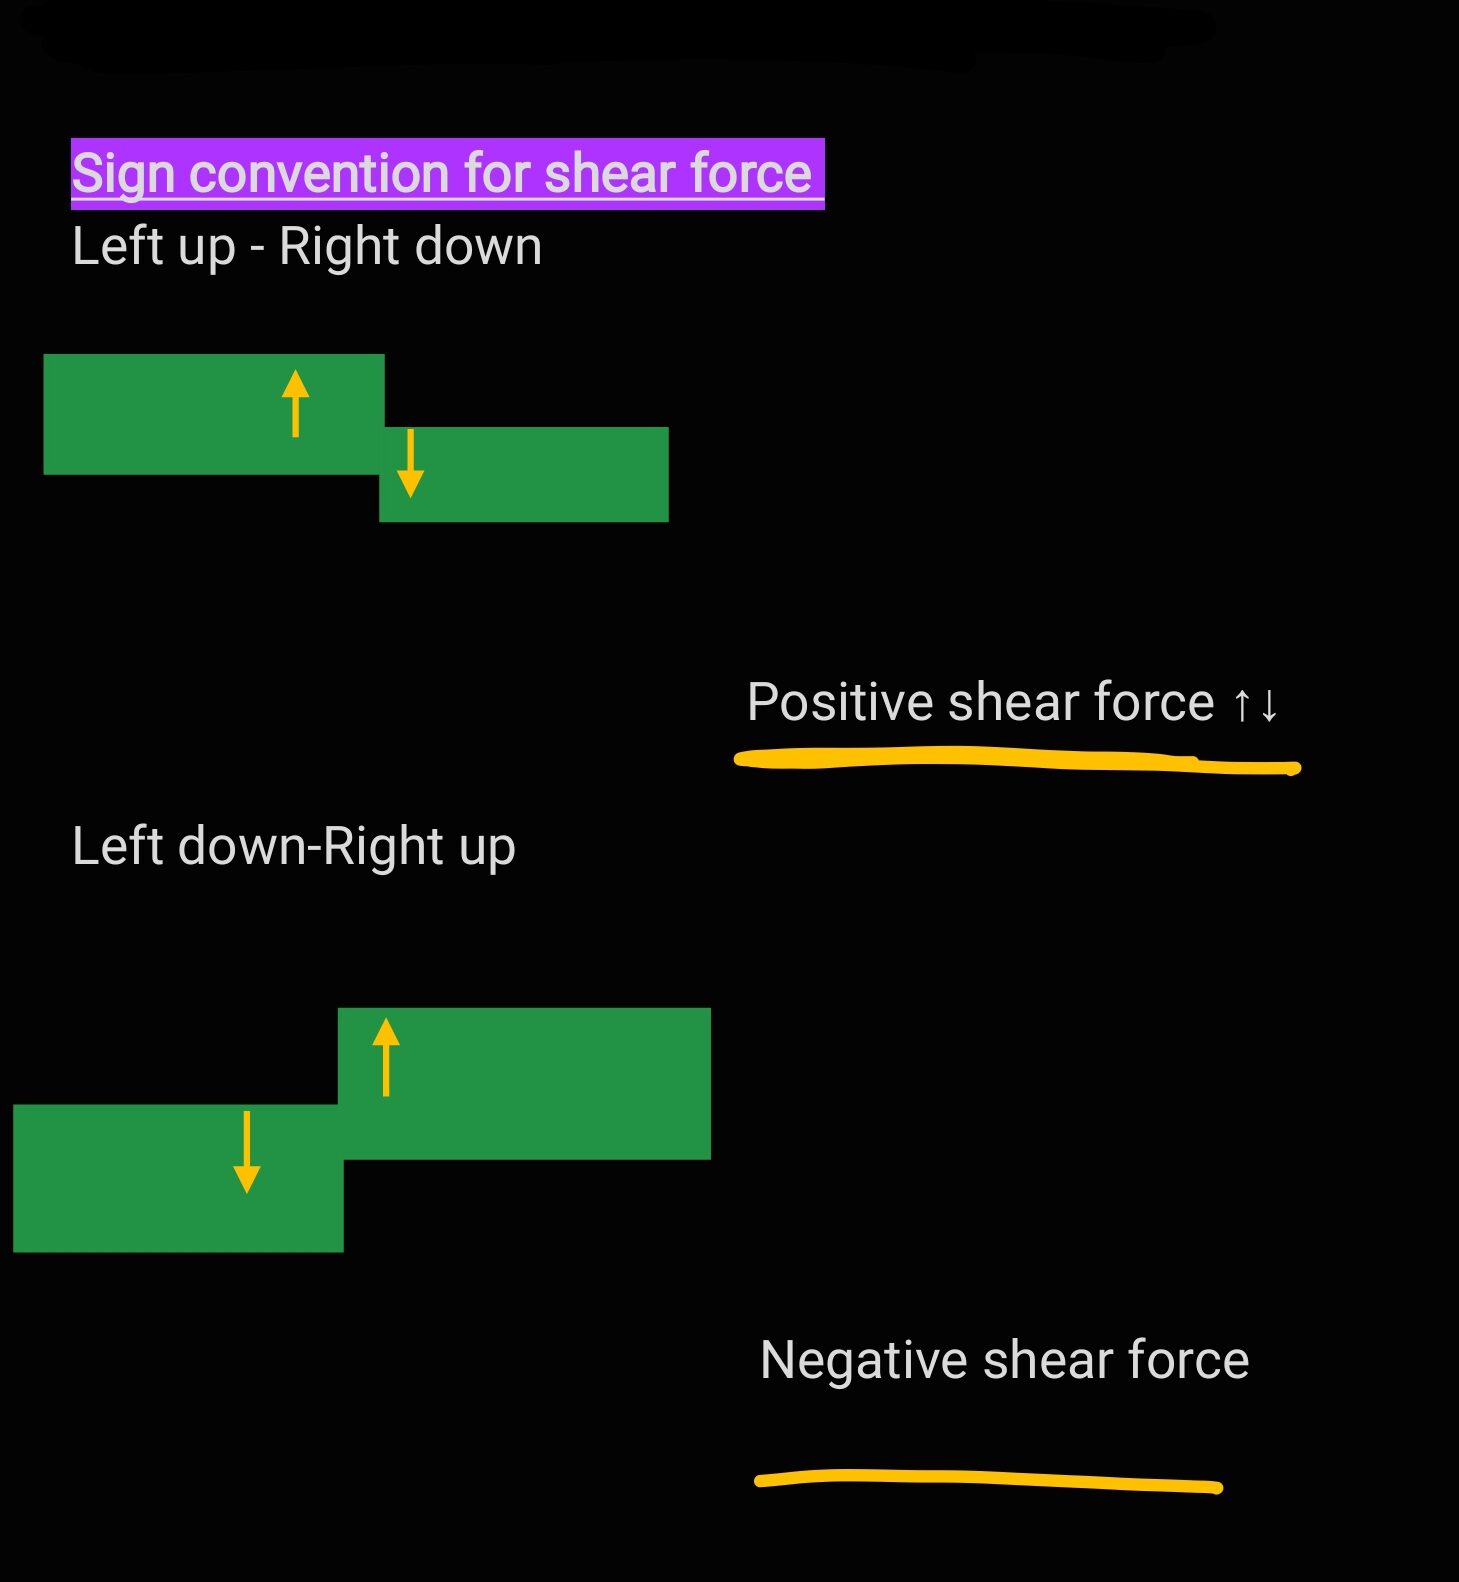
Sign Convention For Shear Force
We find different sign conventions in different books, but in this book we follow this sign convention in the entire book.
Shear Force Diagram:
The shear force plotted as ordinate on the base line representing the axis of the beam is known as SFD.
Procedure to be Followed for Drawing SFD:1. Draw the loading diagram of the beam.
2. Find reactions of the support and draw lines below loading points
3. Start always from left side of the beam as per the los whether it is up or down ward and continue till right.enc of the beam.
4. By the time it reaches right end it has to reach zero of the base line otherwise your reactions calculations may be wrong or loading calculations may be wrong correct it immediately
5. Positive values are plotted above the base line and fiegative values below the base line and hatch it properly and indicate + ve and -ve.
6. Mention the values of shear force at each corner of the diagram.
7 Find the maximum positive shear force and minimum negative shear force values.
8. Where shear force crosses +ve to -ve or vice versa the B.M will be maximum at those points
9. At some place it crosses base line not at nodal point especially under ud! Find x distance where it crosses base line by using similar triangles.
10. For point loads draw vertical lines and under udl draw slope lines linear
BENDING MOMENT
The bending moment at any section of the beam is defined as the algebraic sum of moments of all loads about the section by considering either left of that section or night of that section. It is denoted by the letter M and its units in SI system are KNm.
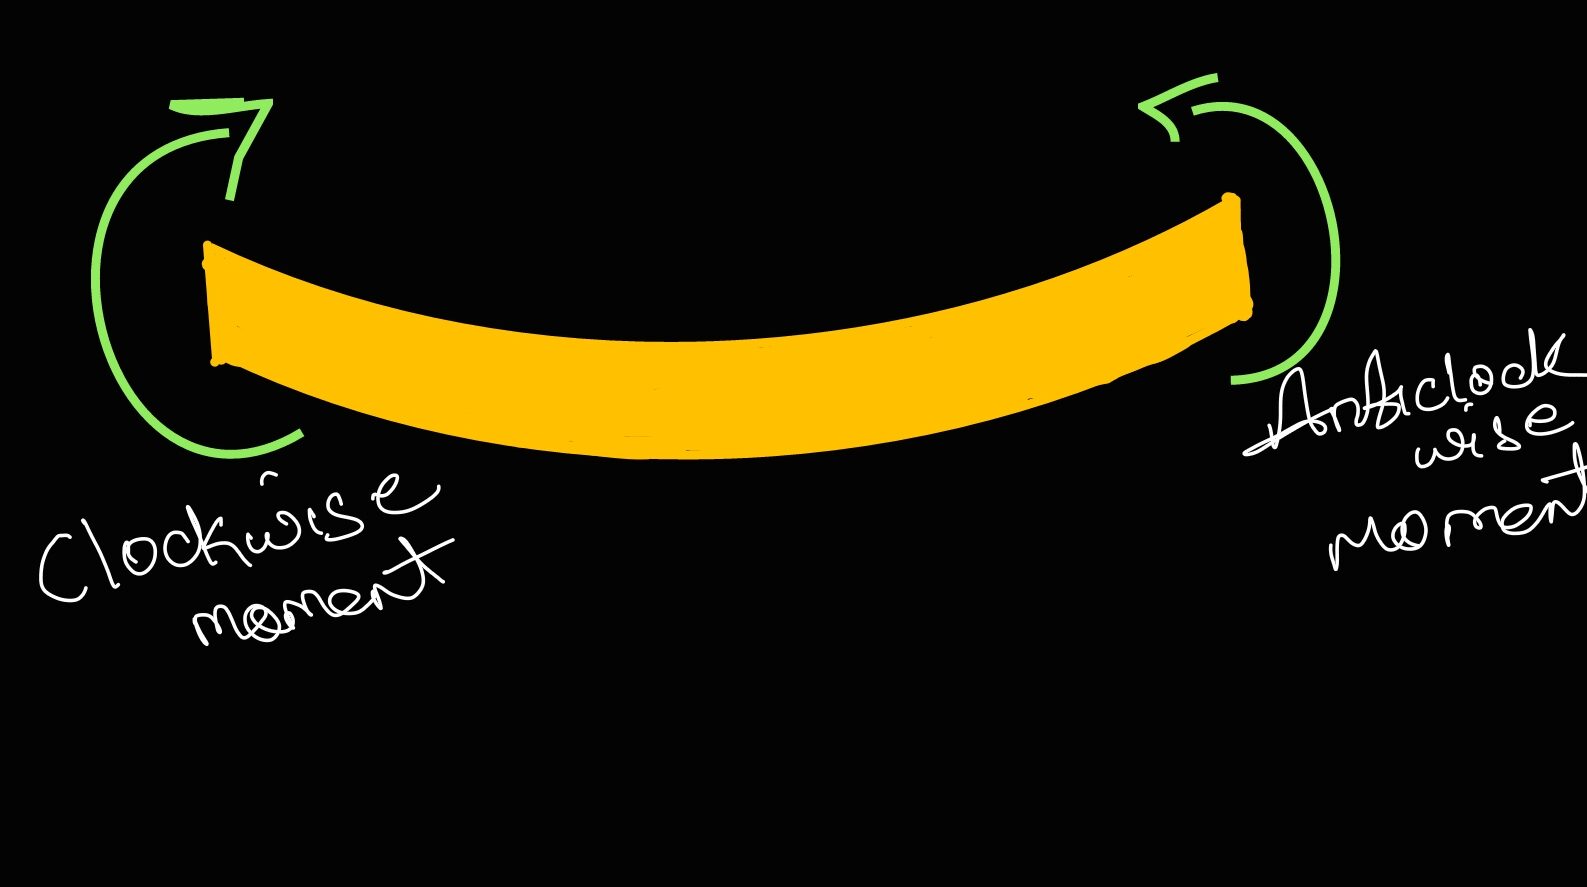
Sign Convention for Bending Moment:
Sagging or Positive Bending Moment: The bending moment at a section is considered to be positive when it causes convexity downwards lor concavity at top) such bending moment is called sagging bending moment or positive bending moment.
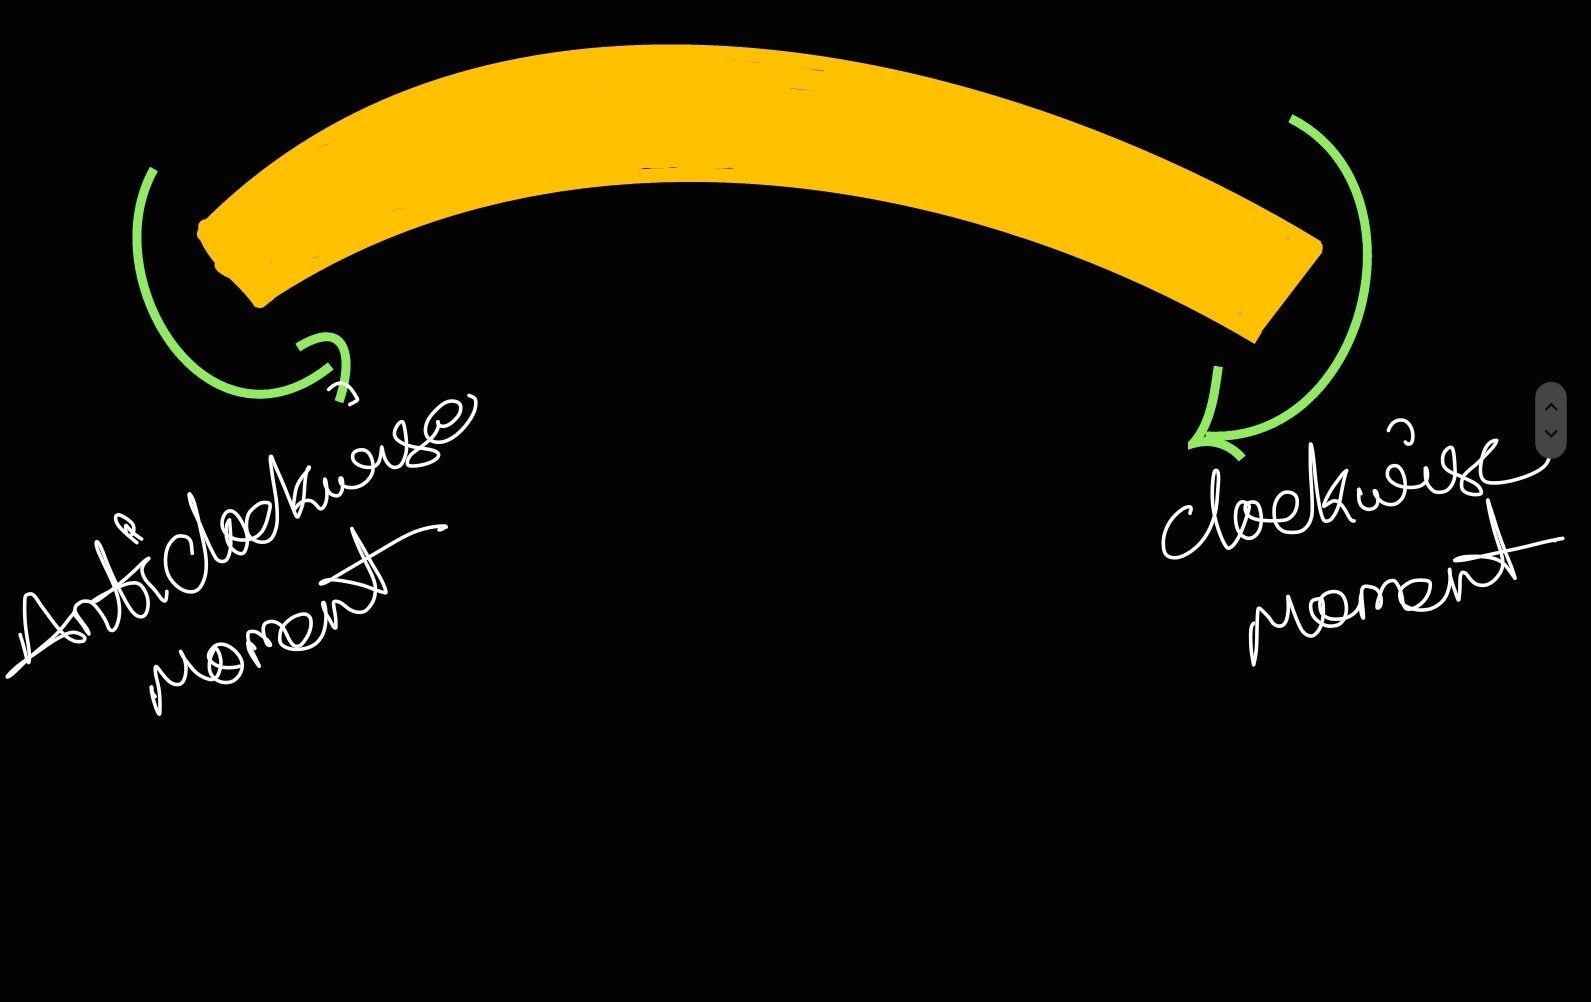
Hogging or Negative Bending Moment: The bending mome at a section is constidered to be negative when it causes conve upwards (or concavity at bottom), such bending moments is calle hoging bending moment or negative B.M
Bending Moment Diagram (BMD):
B.M.D. is a graphical representationatio of the values of bending moments plotted as ordinates on a
Procedure to be Followed for drawing B.M.D:
Calculate the B.M at different salient points with sign Le, +ve or ve
2. Draw the base line and plot the positive values of BM above the base and negative values of BM below the base line.
3. In between point Joods draw slope line and in between udi draw parabolic lines, and watch it properly.
4. Find the max +ve and max-ve BM values and its occurrence